
The best app depends on the question
“Best stock research app” combines several different jobs. Finding an unfamiliar company, filtering a market, reading statements and analyzing a chart do not require the same interface.
Start by identifying the part of your process that feels difficult. Then compare tools on that task instead of treating a long feature list or a familiar brand as proof of fit.
Five useful starting points
| Product | Published focus relevant to this comparison | A useful reason to investigate it |
|---|---|---|
| Stocker | Swipe discovery, company information and saved stocks | You want a focused route from curiosity to a watchlist |
| Apple Stocks | Symbol lists, charts and news | You want a built-in iPhone starting point |
| TradingView | Charts, screeners, analysis tools and alerts | Your main workflow centers on charts and technical tools |
| Simply Wall St | Visual company analysis and stock screening | You want structured screening and visual research |
| Stock Analysis | Company data, financial statements and screening | You want to look up and inspect company information |
This is a documentation-based overview, not a scored product test. We publish Stocker and do not claim an independent laboratory ranking. Feature availability, data coverage and paid-plan limits should be checked with each provider.
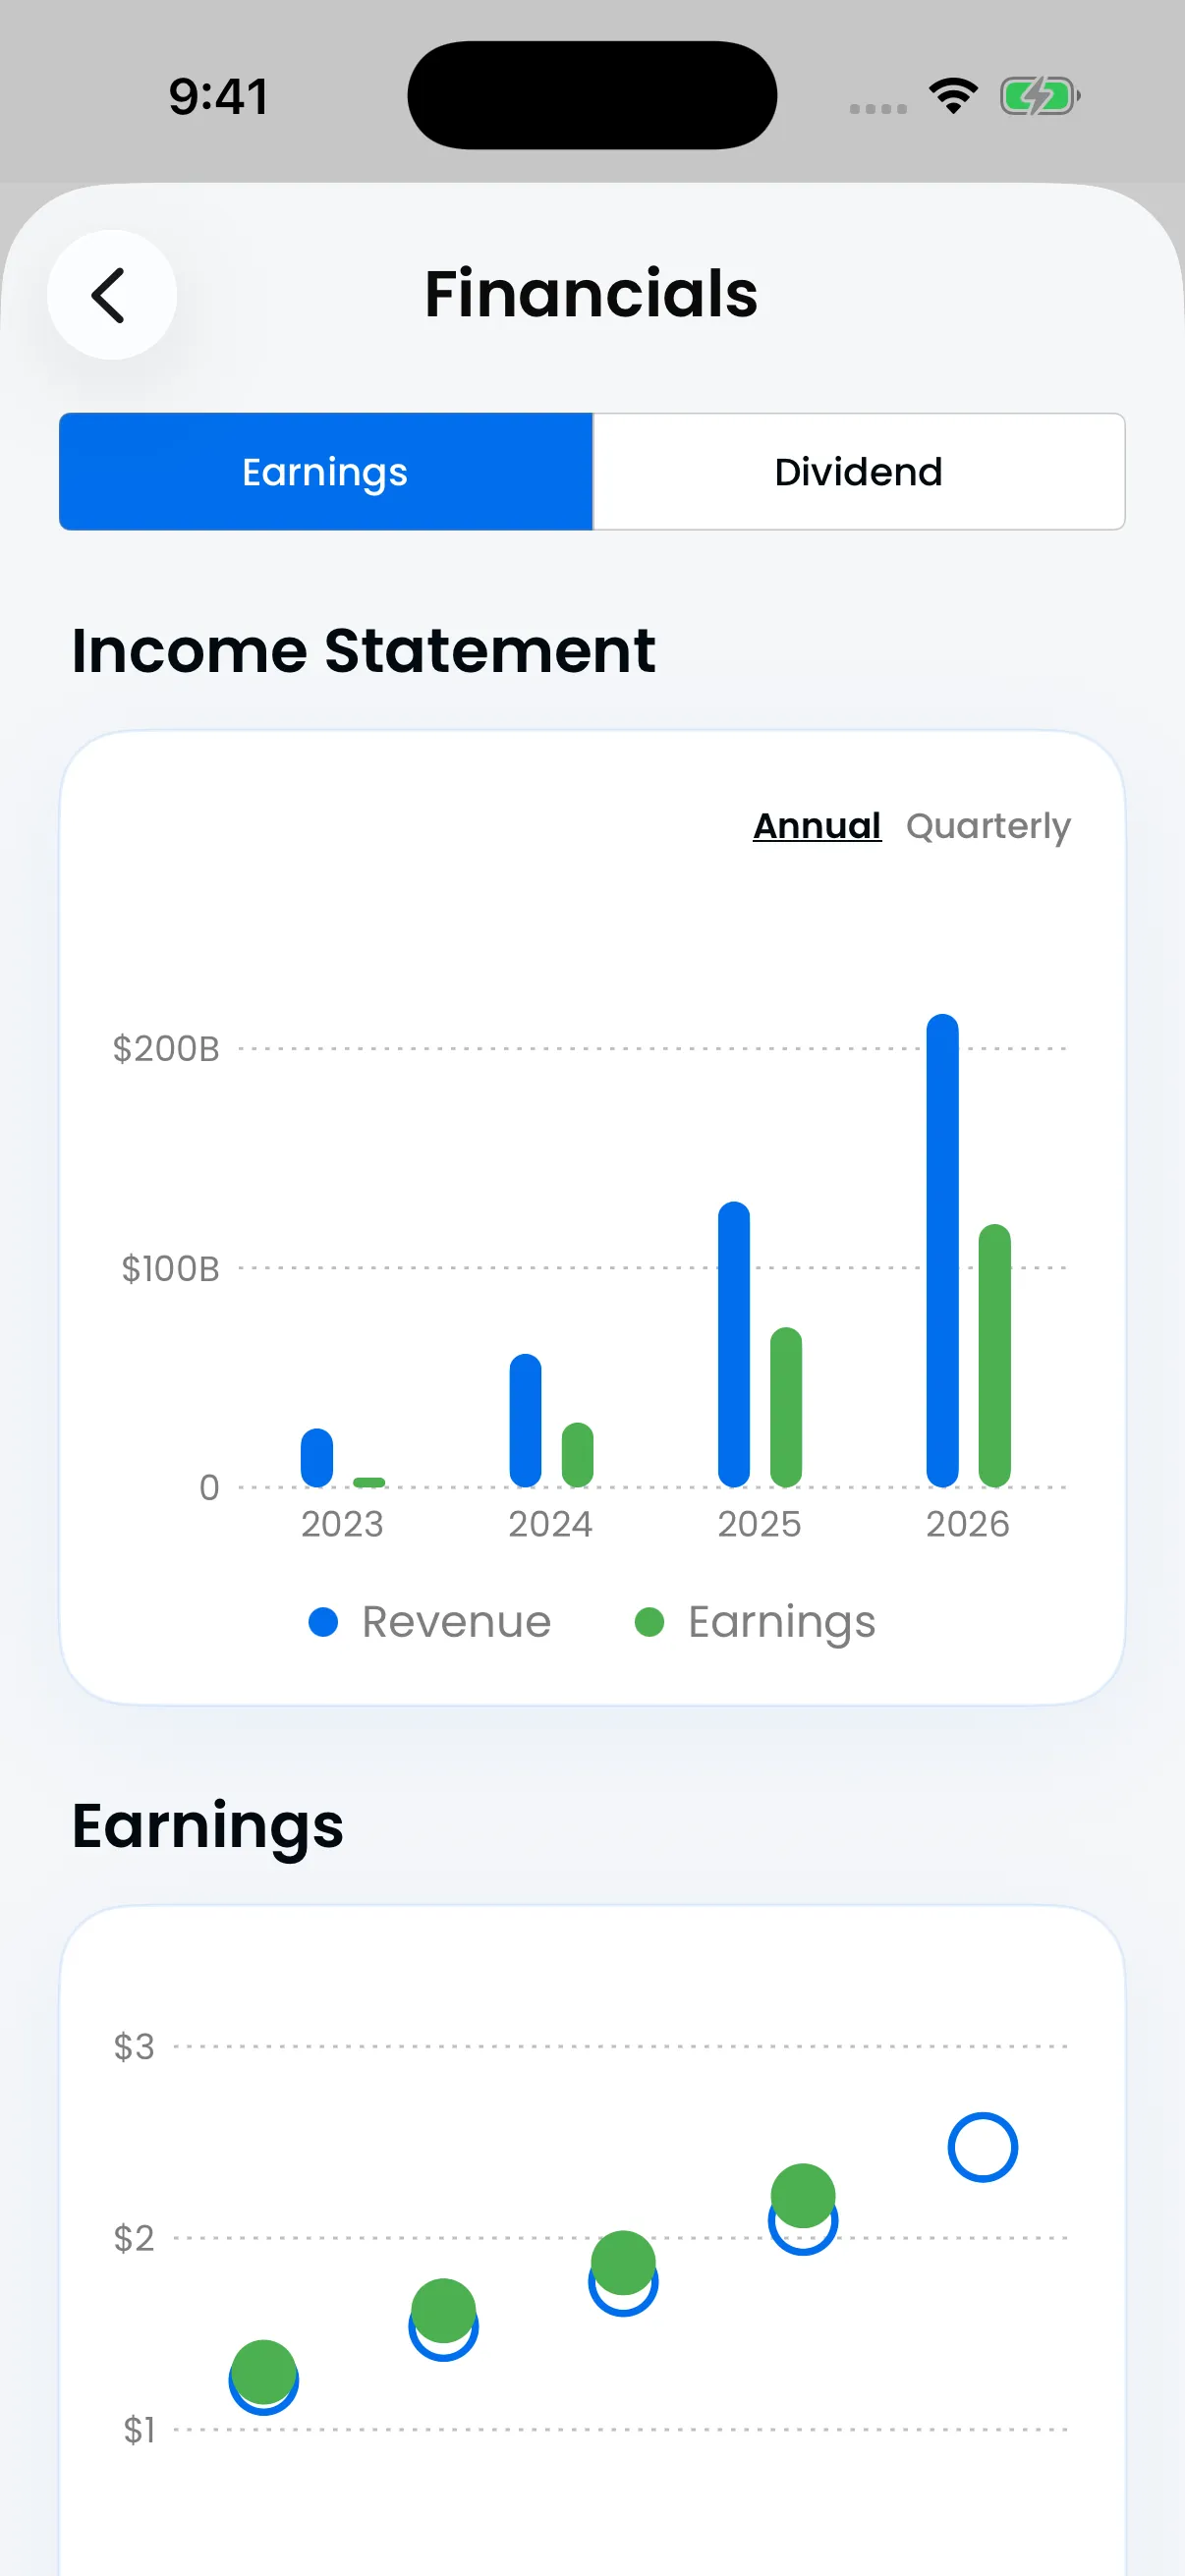
Test research apps against the questions you need answered. Stocker screenshot with historical example data.
Discovery is different from screening
A screener starts with criteria and returns candidates that match. Discovery can begin with interests and introduce you to companies without requiring a detailed filter setup first.
Neither method removes the need to examine the business. A result that matches a filter is not automatically suitable, and a company that matches your interests is not automatically attractively priced.
Stocker fits the discovery-and-save workflow. If your requirement is complex screening, backtesting, real-time trading signals or brokerage execution, evaluate tools that explicitly document those features instead.
Check the data, not just the interface
For an important metric, look for its definition, reporting period and freshness. Compare the same company with its original filing. A missing value should be identifiable as missing, rather than looking like a zero.
Also check how quickly you can move from a summary to the questions behind it. An attractive chart is useful when it helps you investigate; it is less useful if it encourages you to stop at the picture.
Try a small, repeatable evaluation
Use the same three tasks for every product: find a company, understand one financial change, and save a way to revisit it. Note what the free experience permits and what would require payment.
You can keep the comparison simple. The tool that fits your actual routine may be smaller than the one with the most features. For the research itself, use our company research guide and free worksheet.
Sources & further reading
Based on the sources below. Company and app information can change; check the original source before relying on it.
Stocker makes tools for discovery and research. This article is educational and is not a recommendation to buy, sell or hold any security. How we write